Visualizing SoCal’s Diversity Advantage
Many of us know that SoCal has a diversity advantage through its breadth of people, industries, and technologies. I like to say that our diversity is our “regional superpower.” Our population is among the most diverse in the US in terms of breadth of ethnicities and origins – 67% non-white and 30% foreign-born. Though we are most often known to be the global center of media and entertainment, those who live here know that we are also a global center for trade, tourism, biotech & healthcare, aerospace, transportation, and sustainability. We lead in the production of talent with more than 1 million students in higher education (just behind Metro New York) and graduating the largest number of engineers in the country. So does our startup ecosystem share this same diversity? How does it compare to other US start-up hubs?
The Alliance is extremely fortunate to have a long term strategic partnership with the prominent strategy consulting firm Boston Consulting Group (BCG). Through BCG’s Center for Growth & Innovation Analytics, their teams have access to cutting-edge tools including an incredible data analytics & visualization toolkit supported by Quid. Quid is particularly useful for geo-mapping & semantic clustering to uncover market patterns & innovation trends synthesized from multiple databases. A team led out of BCG’s LA office conducted an innovation scan leveraging Quid’s toolkit to review almost 20,000 startups founded since 2010 with a funding event occurring anytime between 2016 through 2020. The scan was geographically bound to cover the 4 largest U.S. startup regions: SoCal, Bay Area, New York Metro, and Boston Metro. The visualization uses color-coding to indicate various technology areas and spatial distance to show the degree of proximity between adjacent innovation themes. Each dot represents a start-up, and dots that cluster together in the same color are associated with a shared sector. So the more spread-out and the more colorful, the more diverse the region; while the denser the cloud, the more similar the companies are in the community.
Here are the four startup region visualizations:

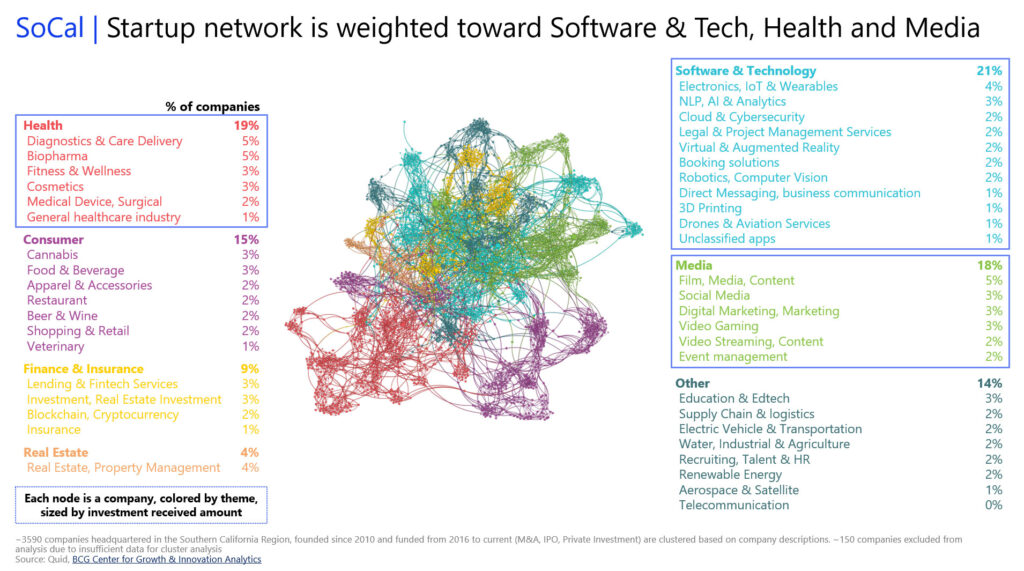
Comparing these four networks, SoCal emerges as having the most diverse spread of startups across industries with multiple areas of excellence (software, healthcare & media each represent ~20% of the startups), while the Bay Area indexes heavily towards software (34% of startups), and Boston on healthcare (32%). New York is also comparatively diverse with two primary industries,software and finance, each accounting for ~20% of total startups in the region.
If we zoom in on SoCal, you can see the subcategories that feed into the various innovation areas. Remember, this view is a consolidation of all of SoCal, so the media segment is most likely driven by LA-based companies and the health (heavily diagnostics and biopharma) are likely benefitting from San Diego startups (the 3rd diagram will show this more clearly).

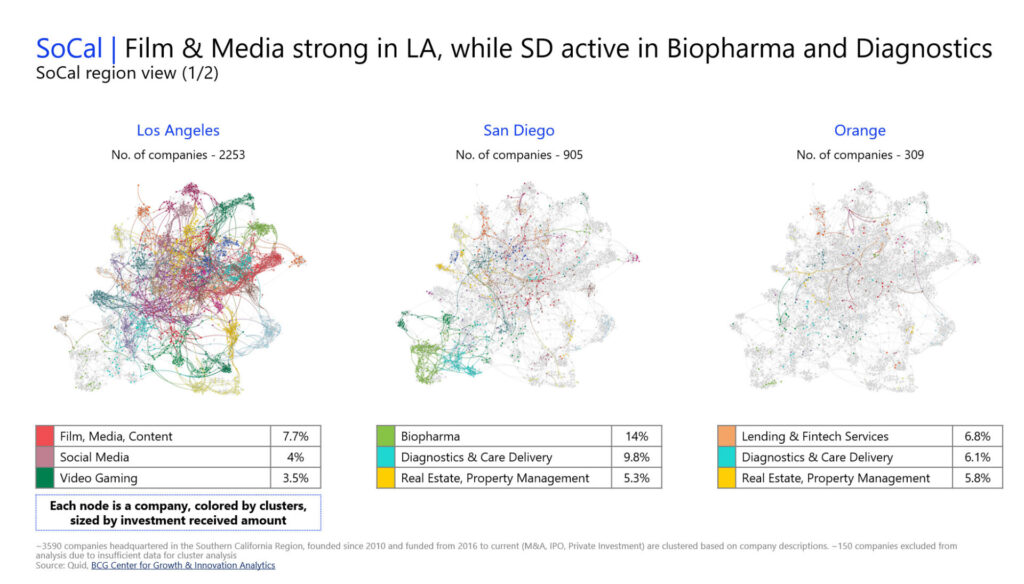
As we know, SoCal is a collection of innovation communities, or nodes, that form the SoCal innovation network. Of the 14 distinct SoCal communities we’ve identified, the three most developed are in Los Angeles, San Diego and Orange counties. There are 11 other smaller nodes with about half defined as subsets of Los Angeles County. So, if you drill down a bit deeper in SoCal, we can see the unique composition of these primary nodes. The cloud density shows the heavy concentration of SoCal startups in the LA region and its weighting toward media & content. As expected, San Diego has significantly fewer startups, but indexes extremely high in both biopharma & diagnostics, while Orange County has even fewer startups than San Diego but shows dominance in fintech and diagnostics.

So now you can speak with greater confidence about the comparative diversity of the SoCal startup ecosystem. This diversity is reflective of the unique, compelling, and complementary competencies of the various communities that collectively create this amazing SoCal innovation ecosystem.